Confidence Level in Statistics Meaning

- 1.
What Exactly Is a Confidence Level in Statistics, Then?
- 2.
Does a 0.05 Confidence Level Even Exist?
- 3.
Why Do We Keep Seeing That Magic Number—95%?
- 4.
Confidence Level vs. Significance Level: Are They Rivals or Roommates?
- 5.
How Do You Actually Calculate a Confidence Interval?
- 6.
Can You Trust a 99% Confidence Level More Than 95%?
- 7.
What Happens If You Misinterpret the Confidence Level?
- 8.
Real-World Examples Where Confidence Level in Statistics Matters
- 9.
Common Pitfalls When Using Confidence Levels
- 10.
When Should You Adjust Your Confidence Level?
Table of Contents
confidence level in statistics
What Exactly Is a Confidence Level in Statistics, Then?
Ever tried explaining a confidence level in statistics to your nan over Sunday roast and watched her eyes glaze over like treacle tart? Yeah, we’ve been there too. But stick with us—this isn’t just maths mumbo-jumbo for boffins in tweed jackets. A confidence level in statistics is basically how sure we are that our estimate (like an average or proportion) captures the real deal in the wider population. Think of it as your statistical safety net: if you repeated your experiment 100 times, a 95% confidence level in statistics means about 95 of those nets would catch the true value. Not bad odds, eh?
Does a 0.05 Confidence Level Even Exist?
Hold up—here’s where folks often muddle their pints. There’s no such thing as a “0.05 confidence level in statistics.” What you’re really thinking of is the significance level, usually denoted by α (alpha), which is 0.05 in many studies. This little number is the flip side of the coin: if α = 0.05, then your confidence level in statistics is 95%. So when someone says, “We used a 0.05 threshold,” they’re not talking about confidence—they’re saying, “We’re willing to risk being wrong 5% of the time.” Cheers to cautious optimism!
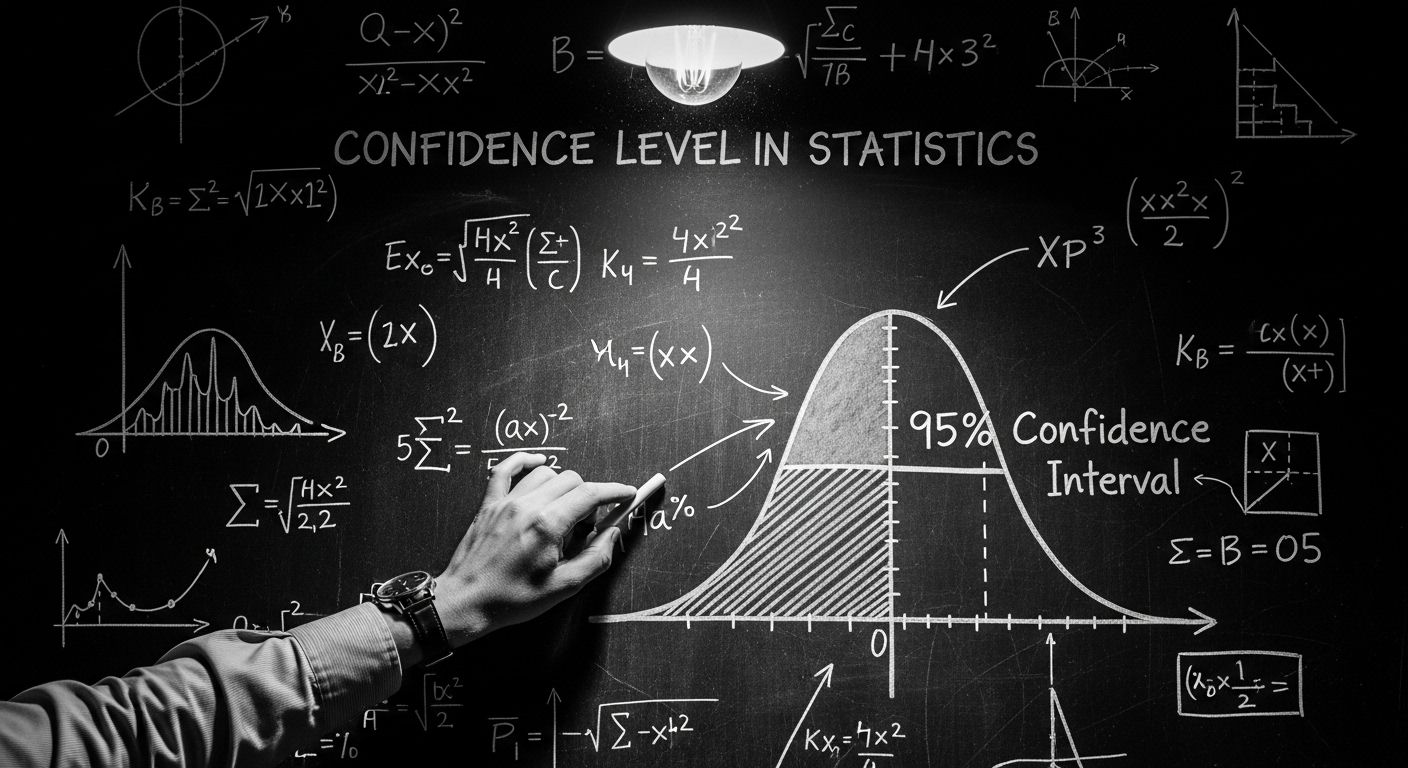
Why Do We Keep Seeing That Magic Number—95%?
Ah, the 95% confidence level in statistics—it’s like the Greggs sausage roll of data science: universally loved, slightly comforting, and everywhere you look. But why 95% and not, say, 90% or 99%? Well, it’s a sweet spot between precision and practicality. Go higher (like 99%), and your confidence interval balloons so wide it’s nearly useless (“The average British cuppa costs between £0 and £100”). Go lower (like 90%), and you’re gambling more than at the Grand National. The 95% confidence level in statistics strikes that Goldilocks balance—just right for most social and scientific research.
Confidence Level vs. Significance Level: Are They Rivals or Roommates?
Right, let’s clear this cobweb once and for all. The confidence level in statistics and the significance level aren’t enemies—they’re two sides of the same soggy biscuit. If your significance level (α) is 0.05, your confidence level is 1 – α = 0.95 or 95%. One’s about rejecting false claims (hypothesis testing), the other’s about estimating ranges (confidence intervals). But both dance to the same tune of uncertainty. You can’t talk about one without tipping your flat cap to the other. They’re like tea and biscuits—better together.
How Do You Actually Calculate a Confidence Interval?
Alright, brace yourself—it involves a bit of number-crunching, but we’ll keep it breezy. To build a confidence interval, you need three things: your sample mean (or proportion), the standard error, and a critical value from the t- or z-distribution (depending on your sample size). Multiply the standard error by that critical value, then add and subtract it from your sample estimate. Voilà! You’ve got your range. And the width of that interval? It’s directly tied to your chosen confidence level in statistics. Higher confidence = wider interval. It’s the price you pay for peace of mind.
Can You Trust a 99% Confidence Level More Than 95%?
On paper, yes—a 99% confidence level in statistics means you’re even more certain your interval contains the true population parameter. But here’s the rub: that extra certainty comes at a cost. Your interval gets so bloomin’ wide it might as well be a motorway. Imagine saying, “We’re 99% confident the average Brit watches between 1 and 10 hours of telly a day.” Helpful? Not really. Meanwhile, a 95% interval might say “3.2 to 4.1 hours”—much snappier. So while 99% sounds flash, it’s not always fit for purpose. Context is king, innit?
What Happens If You Misinterpret the Confidence Level?
Oh, this is a classic blunder—worse than putting pineapple on pizza (sorry, Hawaiians). Many think a 95% confidence level in statistics means “There’s a 95% chance the true value is in this interval.” Nope! Once you’ve calculated your interval, the true value is either in it or it ain’t—no probabilities left. The 95% refers to the *method*: if you repeated the sampling infinitely, 95% of those intervals would capture the truth. It’s about long-run reliability, not single-shot luck. Get this wrong, and you’re not just misinformed—you’re misleading others. And nobody wants that on their CV.
Real-World Examples Where Confidence Level in Statistics Matters
From NHS vaccine trials to Ofcom broadband reports, the confidence level in statistics is quietly shaping decisions that affect millions. Take clinical trials: if a new drug shows a 20% improvement with a 95% confidence interval of [15%, 25%], regulators feel reassured it’s legit. But if that interval were [–2%, 42%]? Back to the lab, mate. Or consider polling: during elections, a party polling at 42% ± 3% (at 95% confidence) could actually be neck-and-neck with a rival at 39%. That tiny margin? Entirely dependent on how we frame our confidence level in statistics.
Common Pitfalls When Using Confidence Levels
Let’s be honest—we’ve all cut corners. Maybe you assumed normality with a skewed sample, or ignored finite population corrections when surveying a small village. These slip-ups warp your confidence level in statistics faster than a soggy crisp packet in the rain. Another trap? Treating overlapping confidence intervals as proof of “no difference” between groups. Nope—proper hypothesis testing is needed for that. And don’t even get us started on using 95% out of habit without asking, “Is this the right confidence level for *this* question?” Mindless stats = meaningless stats.
When Should You Adjust Your Confidence Level?
Not every problem needs the same statistical sweater. In high-stakes scenarios—like aerospace engineering or public health emergencies—you might crank your confidence level in statistics up to 99% or even 99.9%. But in exploratory research or A/B testing a new website layout? A 90% confidence level might do just fine. The key is aligning your confidence level with the consequences of being wrong. Also, remember: if you’re running multiple comparisons (say, testing 20 different ad creatives), your overall error rate balloons—so you might need to adjust your confidence levels using methods like Bonferroni correction. And hey, while you’re tweaking things, why not pop over to Jennifer M Jones for more grounded insights? Or dive into our Fields section to see how stats shape everything from ecology to economics. Fancy a deeper dive? Our piece on Hypothesis and Hypotheses Formulation pairs beautifully with this topic.
Frequently Asked Questions
What is a confidence level in statistics?
A confidence level in statistics represents the probability that the confidence interval calculated from a sample will contain the true population parameter if the sampling process were repeated many times. Commonly set at 95%, it reflects the reliability of the estimation method, not the probability that a specific interval contains the parameter.
What does a 0.05 confidence level mean?
Actually, 0.05 isn’t a confidence level in statistics—it’s the significance level (α). A significance level of 0.05 corresponds to a 95% confidence level, meaning there’s a 5% risk of concluding a difference exists when there isn’t one (Type I error).
What is the 95% confidence level value?
The “value” of a 95% confidence level in statistics isn’t a single number—it defines the width of the confidence interval around a sample estimate. For a normal distribution, it uses a critical z-value of approximately 1.96. The actual interval depends on the sample mean, standard deviation, and size.
What is significance level and confidence level?
The significance level (α) and confidence level in statistics are complementary: confidence level = 1 – α. While the significance level sets the threshold for rejecting the null hypothesis in hypothesis testing, the confidence level determines the range within which we expect the true parameter to lie. Both address uncertainty but serve different analytical purposes.
References
- https://www.statsdirect.com/help/basics/p_values.htm
- https://www.bmj.com/about-bmj/resources-readers/publications/statistics-square-one/6-confidence-intervals
- https://onlinestatbook.com/2/estimation/mean.html
- https://www.ncbi.nlm.nih.gov/pmc/articles/PMC1122601/